
Second full month of electricity usage, and the first full month since we are able to export power to the grid. How did we do?
Some Stats
Here’s some stats for July-2026.
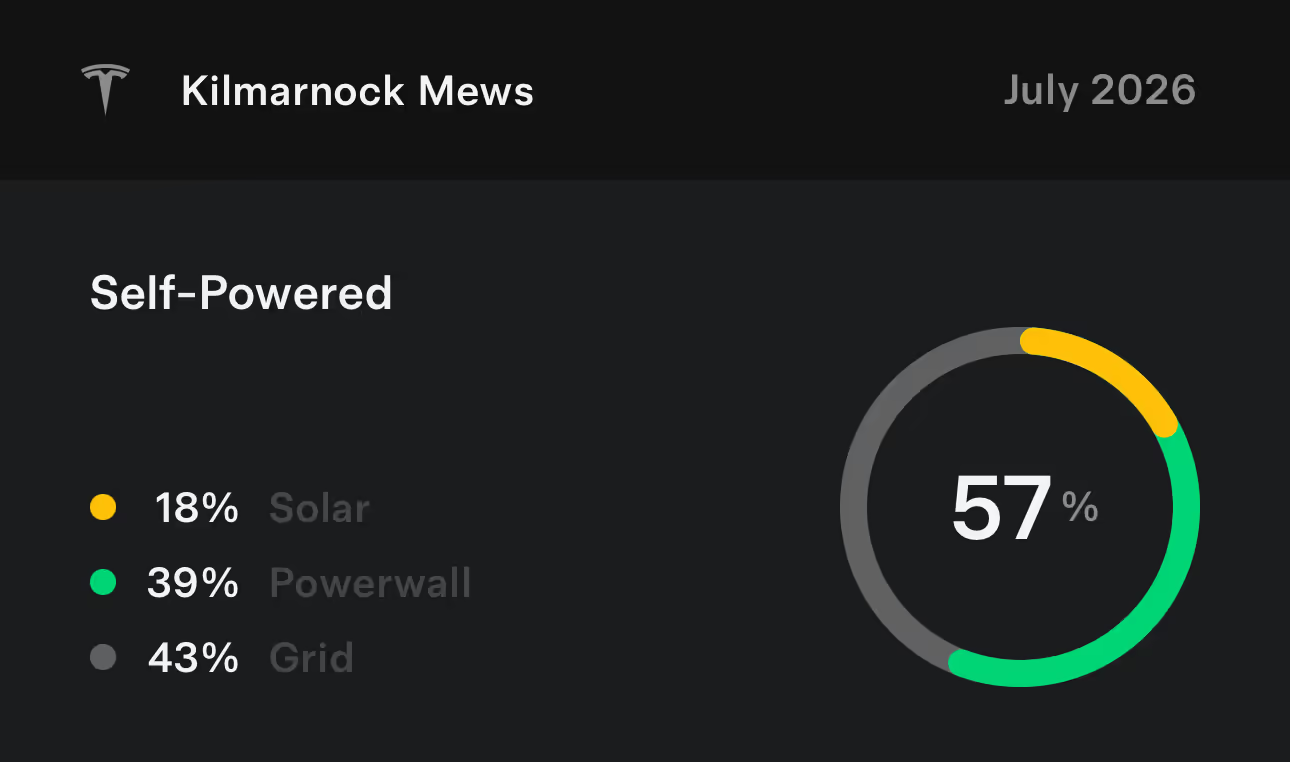
210.8 (from solar) – 18%
445.1 (from battery) – 39%
481.6 (from grid) – 43%
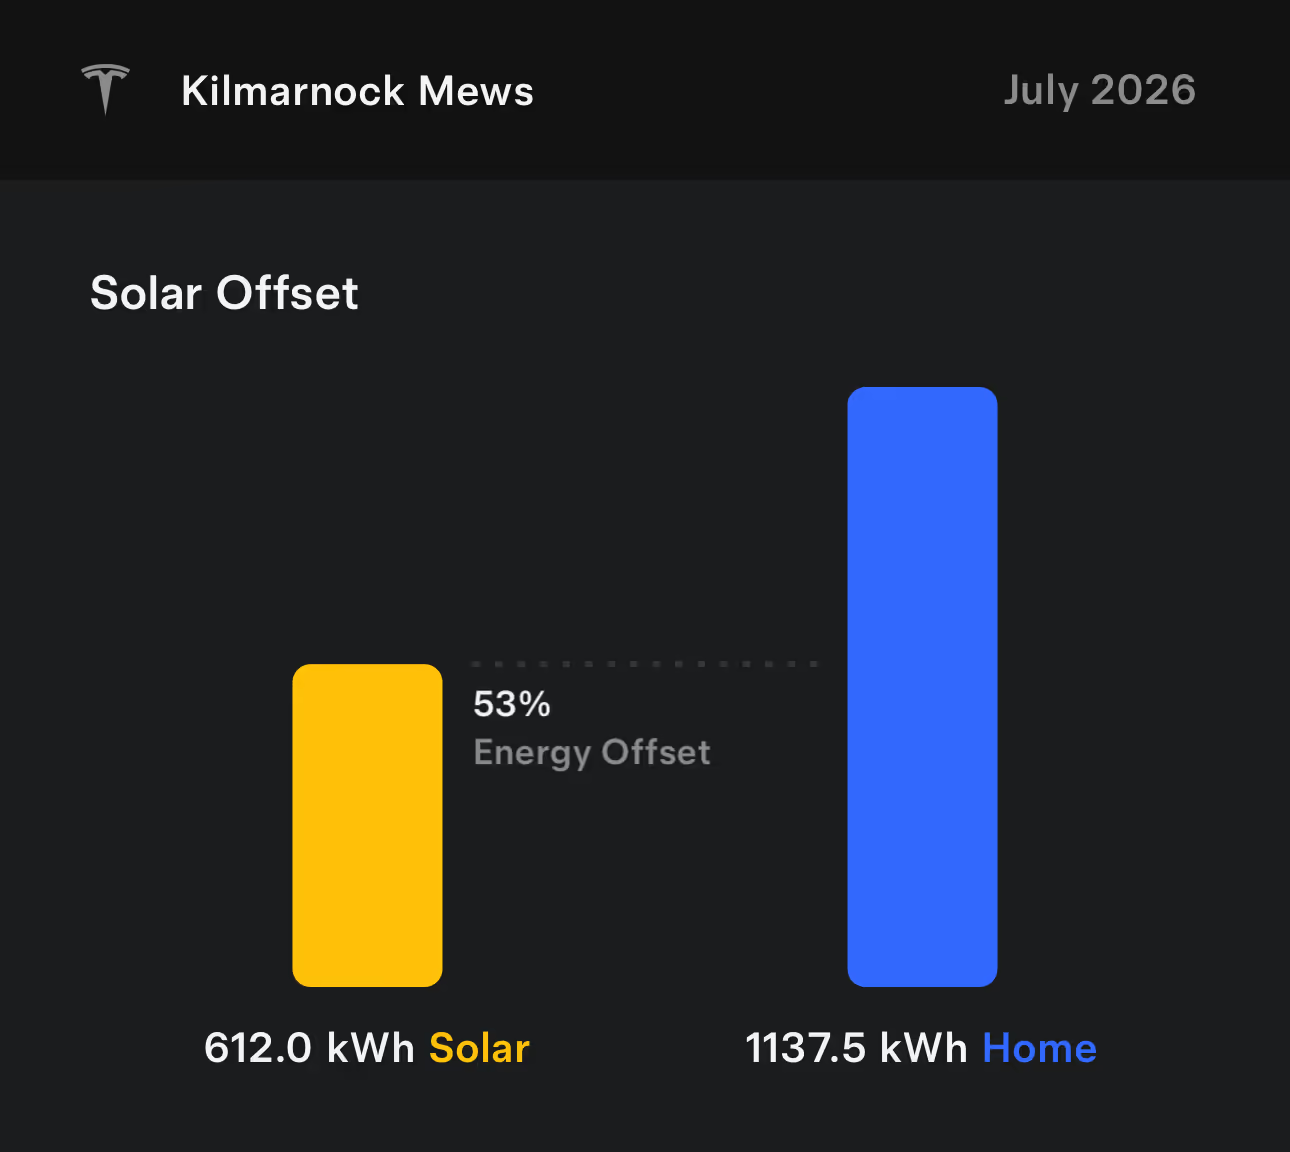
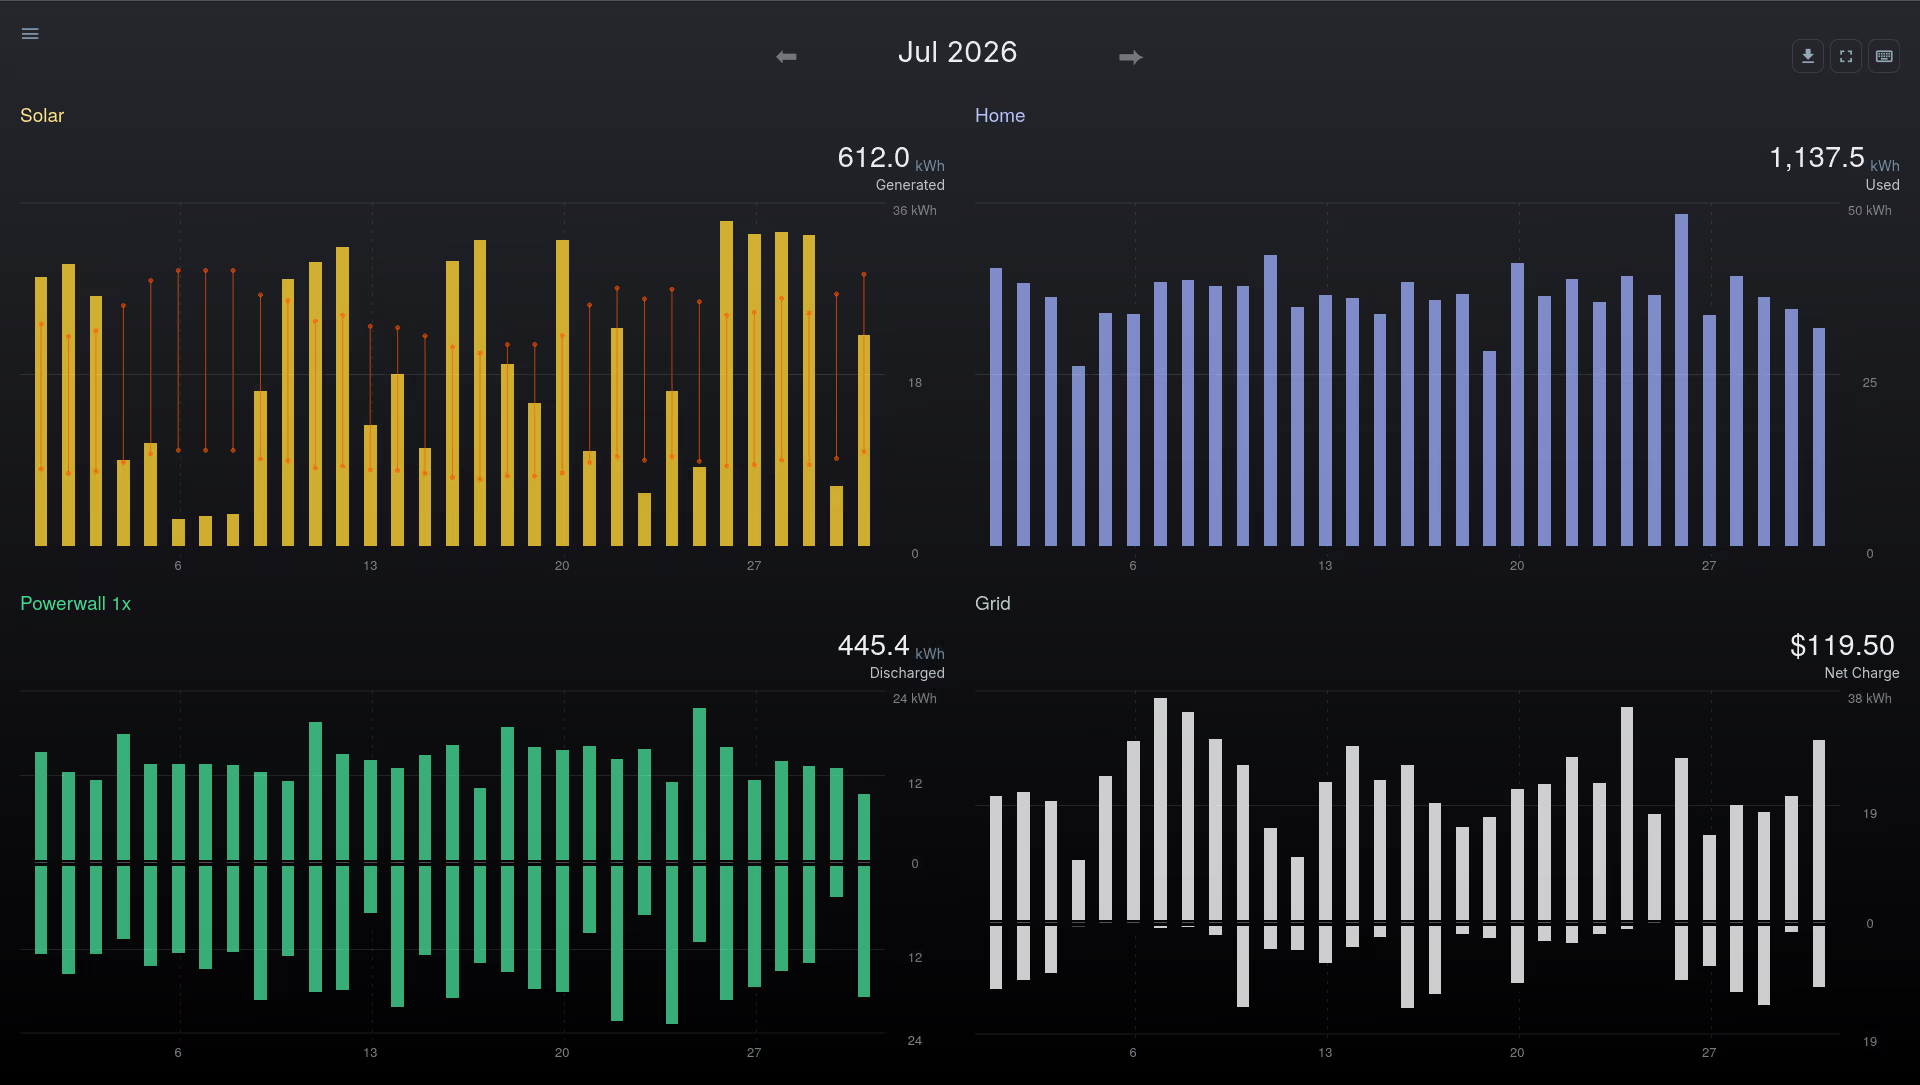
Total: 1,137.5 kWh
210.8 (to home) – 34%
234.5 (to battery) – 38%
166.8 (to grid) – 28%
Total: 612.0 kWh
Charged
234.5 (from solar) – 51%
224.4 (from grid) – 49%
Total: 458.8 kWh
Discharged
445.1 (to home)
0.3 (to grid)
Total: 445.4 kWh
Imported
481.6 (to home) – 68%
224.4 (to battery) – 32%
Total: 706.0 kWh
Time-of-Use Breakdown
447.6 Super Off-Peak – 63%
204.9 Off-Peak – 29%
49.9 Partial Peak – 7%
3.5 Peak – 1%
Total Import Cost: $156.99
Exported
166.8 (from solar)
0.3 (from battery)
Total: 167.1 kWh
Time-of-Use Breakdown
69.3 Partial Peak – 41%
97.8 Peak – 59%
Total Export Credit: $37.50
Net Charge: $119.50
Daily Charge (31 days): $50.16
Total Charge Expected: $169.66
Actual Charge Billed: TBC
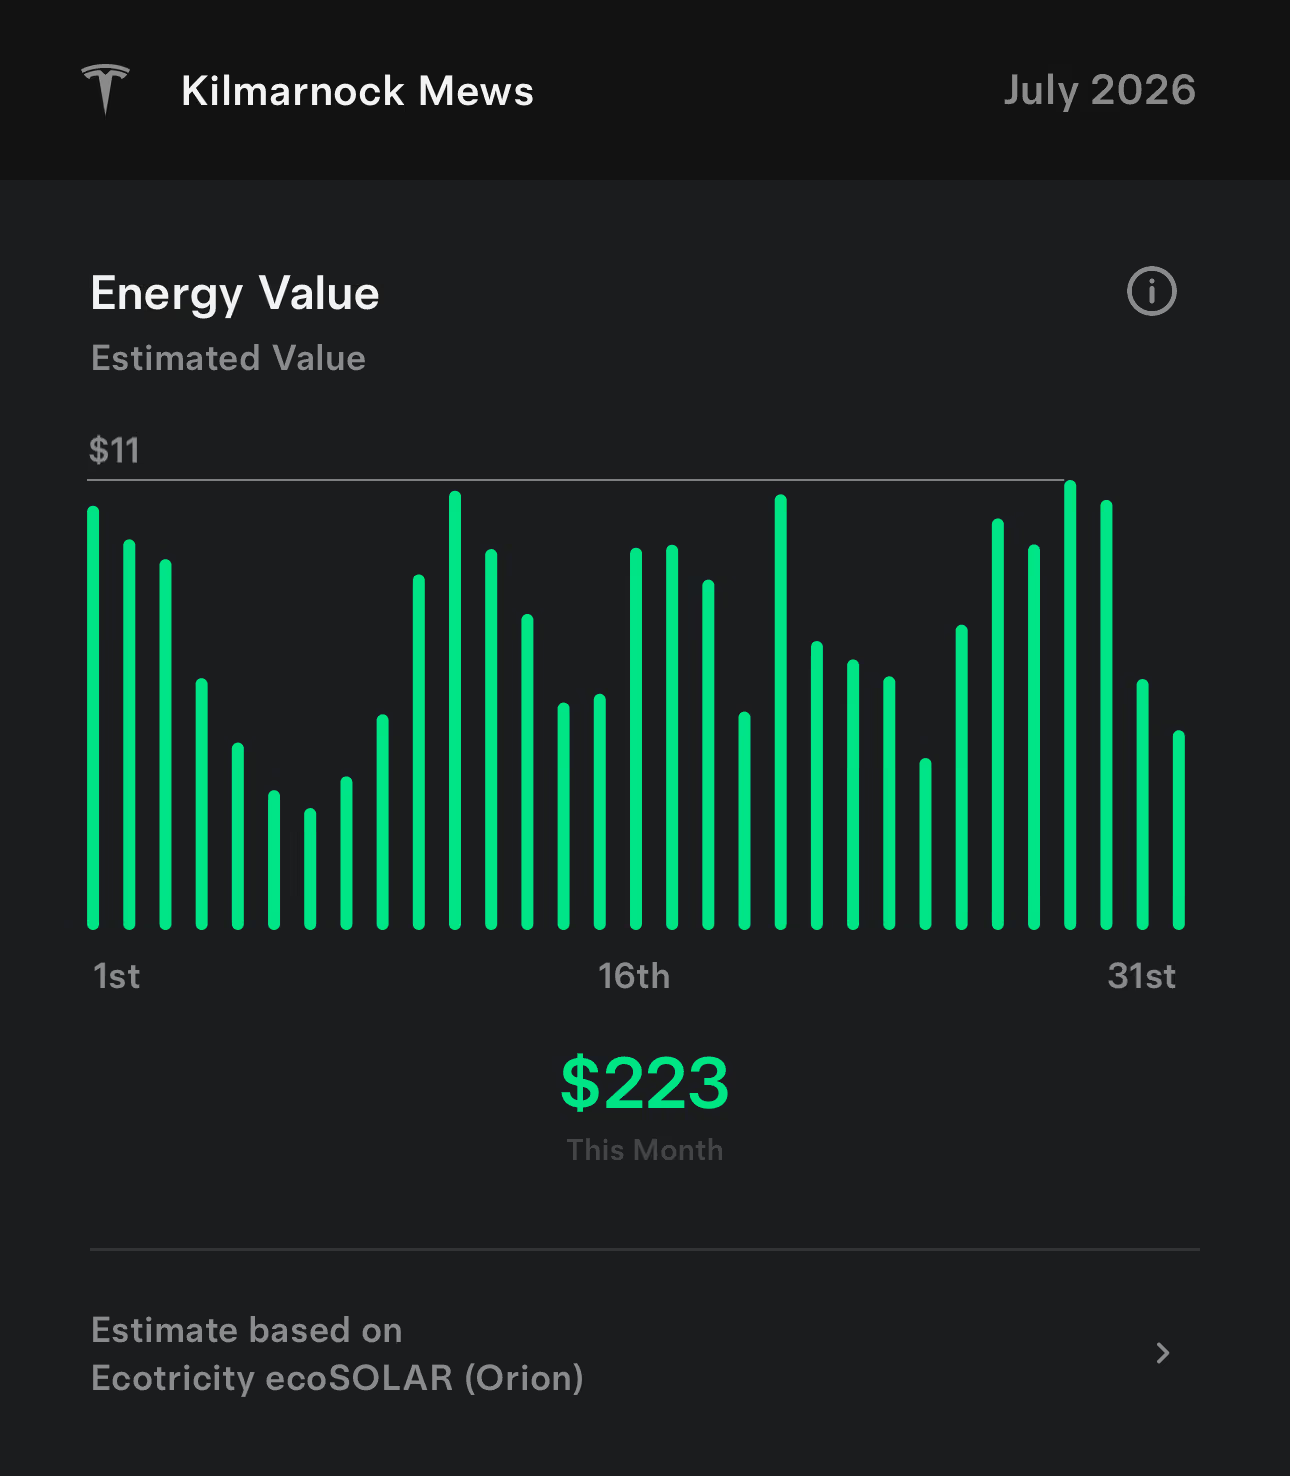
Savings from the solar & battery system as estimated by the manufacturer: $233
Graphs & Charts
Findings
We use more electricity this month, but our bills are expected to be about the same as last month because we are now exporting excess solar to the grid. The system prioritises exports during our morning peak hours (7-11am), powering the house on battery at that time, and then using the excess solar between 11am-5pm to charge the battery.
Last July (2025) we use less electricity (about 973.5 kWh) and the bill is about $287.19 (average of two bills covering 16-Jun to 15-Jul, and 16-Jul to 15-Aug). This year, we use about 17% more electricity but our bill is expected to be about 60% of last year’s despite the price increases. That’s a great outcome 🙂